If you run a supplier diversity, supplier inclusion or small business program and need to know what to compare yourself against, the public benchmark set has shrunk. We read the latest reports and supplier pages of every company in the 2026 Fortune 100 for our disclosure audit, and computed these benchmarks from what they publish.
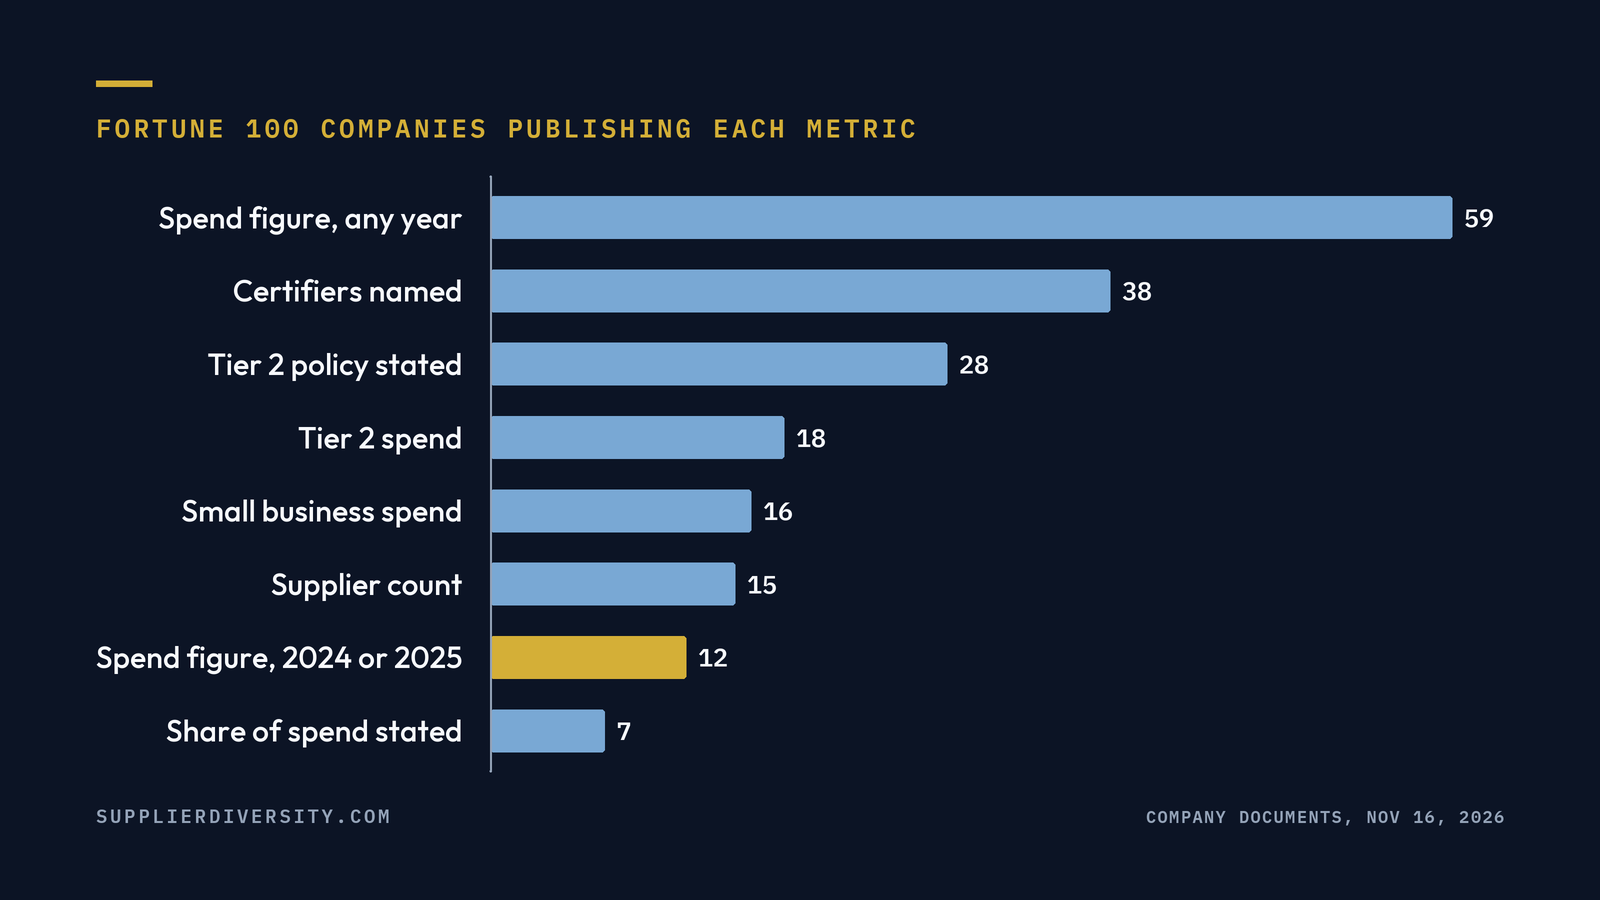
- A spend figure is the one metric most companies have published. 59 of the 100 have published one, each with its own definition; the median latest figure is $1.2 billion, and the middle half runs from about $0.7 billion to about $3.5 billion. Only 12 publish one for 2024 or 2025.
- Share of spend is rare. Seven companies state their figure as a share of spend, from 6.8% to 28%, and we can compute two more. The denominators differ: total spend, or a narrower addressable or sourceable base.
- Tier 2 adds a little under a third. Among 15 companies that published comparable Tier 1 and Tier 2 figures for the same year, the median Tier 2 figure is 29 cents per Tier 1 dollar, from 4 cents (Delta) to 74 cents (CVS Health).
- Supplier counts run from 215 to 5,100. Fifteen companies publish how many suppliers sit in the category they report, and the categories differ.
The company-level data behind every number is in the audit's free CSV download.
What the Fortune 100 disclose, metric by metric
| Metric | Companies publishing it (latest document) | What the published values show |
|---|---|---|
| Spend figure, any year (each company's definition) | 59 (12 for 2024 or 2025) | Median $1.2 billion; middle half about $0.7 billion to $3.5 billion |
| Certifying bodies named | 38 | NMSDC named by 32, WBENC by 31 |
| Ask or encourage primes to use or report diverse subcontractors | 28 | A stated Tier 2 policy, not always a number |
| Tier 2 spend | 18 | Median 29 cents per Tier 1 dollar (15 comparable) |
| Small business spend reported separately | 16 | Often the replacement metric in newer reports |
| Number of suppliers in the reported category | 15 | 215 to 5,100 |
| Share of spend | 7 stated, 2 computed by us | 6.8% to 28% |
A company counts once per metric, in the latest document in which it published that metric. Most of the spend figures are for 2023, the last year 31 of the companies published one, and many combine Tier 1 with Tier 2 or diverse with small businesses: Goldman Sachs, Prudential, American Airlines, Verizon, PepsiCo and Travelers count both tiers or direct and indirect spend, and Target, Cencora, RTX and Boeing include small businesses. Check the definition column in the CSV before you compare.
Share of spend: the number everyone asks for and few publish
| Company | Share | Year | Counted against | What is counted |
|---|---|---|---|---|
| RTX | 28% | 2023 | Supplier spend excluding intercompany and unaddressable spend | Small and diverse |
| AT&T | more than 21.5% | 2023 | All supplier expenditures | Underrepresented businesses |
| CVS Health | 19.5% | 2023 | Sourceable spend | Diverse and small |
| Merck | 15% | 2023 | Global procurement spend | Small and diverse, Tier 1 and Tier 2 (Merck's 18% for 2024 is tied to its economic inclusion program, which its CEO letter describes as small suppliers) |
| JPMorgan Chase | about 11.6% (our division) | 2025 | Total procurement (about $25 billion) | Tier 1 small and/or diverse (about $2.9 billion) |
| Bank of America | about 11% (our division) | 2023 | Annual spending (more than $18 billion) | Diverse suppliers (about $2 billion) |
| Goldman Sachs | 7% | 2023 | Addressable spend | Small and diverse, Tier 1 and Tier 2 together |
| Humana | 6.96% | 2025 | Total supplier spend | Diverse, including HUBZone and small |
| Allstate | 6.8% | 2023 | Total procurement spending | Diverse |
We left out General Dynamics' 34.8%, which counts small businesses only, and HP's 0.4%, one partial row of a table with no total.
The denominator decides the answer. "Addressable" or "sourceable" spend leaves out categories a company says it cannot shift (intercompany charges, for example), which raises the share. A share of total procurement is lower for the same dollars. So is a narrower numerator: several of the higher shares count small businesses too.
Benchmark against a peer only after you match both halves: the same definition of what counts, and the same denominator. If a vendor or consultant quotes an industry "average share," ask which of these they used.
Tier 2: what it adds
Tier 2 is spend your prime suppliers place with diverse or small subcontractors on your business. Among the 15 companies that published both figures for the same year, on that basis:
| Tier 2 per Tier 1 dollar | Companies |
|---|---|
| Under 20 cents | Delta, Merck, Target, Comcast, Cigna |
| 20 to 40 cents | Johnson & Johnson, Amazon, Disney, JPMorgan Chase, Phillips 66, UnitedHealth Group |
| 40 cents or more | Ford, IBM, General Motors, CVS Health |
The median is 29 cents. We left out three figures that measure suppliers' whole supply chains rather than spend on the company's business: Allstate's $6 billion (what its reporting partners said they spent globally with their own diverse suppliers), Dell's (what its suppliers reported spending with small and diverse companies) and American Express's ($125 million tracked across 58 suppliers' own supply chains). Tier 2 figures are self-reported by suppliers; General Motors says so in a footnote ("Tier II spend is self-reported by suppliers.").
A KPI set you can defend in 2026
Copy this into a program charter or a quarterly report. Each line names the formula and the public reference point from the Fortune 100's own disclosures.
| KPI | Formula | Public reference point |
|---|---|---|
| Tier 1 spend | Dollars paid directly to suppliers holding a current, third-party certification you recognize, in the period | Published figures (each company's definition) have a median of $1.2 billion across 59 companies; your scale will differ, so track your own trend first |
| Tier 1 share | Tier 1 spend ÷ the denominator you choose (state it: total, addressable or sourceable) | 6.8% to 28% across 9 companies (7 stated, 2 computed) |
| Small business spend (separate line) | Dollars paid to suppliers that are small under the SBA size standard for their primary NAICS code | 16 companies report it separately |
| Tier 2 spend | Dollars your primes report spending with certified or small subcontractors on your business | Median 29 cents per Tier 1 dollar (15 companies) |
| Active suppliers | Count of certified or small suppliers paid at least once in the period | 215 to 5,100 (15 companies, mixed definitions) |
| Certification coverage | Share of Tier 1 dollars whose supplier certification is verified and unexpired on the payment date | We did not find it published; worth tracking anyway |
Three practices separate a defensible number from a soft one:
- Publish the definition next to the number, and say when it changes. The audit found companies that widened a diverse-only figure to include small businesses from one year to the next; a footnote is the difference between a trend and a break in the series.
- Report small business and diverse-owned spend on separate lines. ConocoPhillips does: $1,262 million with diverse suppliers and "an additional $1,088 million" with small business enterprises in 2025. Separate lines survive a change of program name; a blended line does not.
- Check whether a regulator already sets your definitions. California utilities, insurers and hospitals, and Illinois utilities and insurers, must report on fixed categories and dates; see supplier diversity reporting requirements. Federal primes report subcontracting in SBA's categories, and the FY2025 scorecard shows what agencies achieved.
For how to define and track each metric inside your own systems, see our supplier diversity metrics and KPIs guide; for Tier 2 mechanics, our Tier 2 setup guide.
If you are a supplier reading this
Two things in these numbers matter to you. A large buyer's program is typically a few hundred to a few thousand suppliers deep, so expect real competition in each category. And at the companies that measure Tier 2, it adds a little under a third to Tier 1 dollars at the median: if a target buyer asks its primes to report Tier 2 spend, sell to those primes too.
How we built this
- Source data: our Fortune 100 disclosure audit, read on each company's own documents on November 16, 2026, one row per company with the document and a verbatim quote.
- Computed by us: every median, range and count above; JPMorgan Chase's and Bank of America's shares, each from two figures in the same sentence of the company's report; and the Tier 2 ratios, using Tier 1 and Tier 2 figures from the same document and year.
- Excluded: HP's partial 2025 row and Tesla's single-program cumulative figure (not company-wide); General Dynamics' small-business-only share; and the Allstate, Dell and American Express Tier 2 figures, which measure suppliers' whole supply chains.
- Limits: the figures span 2021 to 2025 and use each company's own definition; most are for 2023. Medians describe what these companies published, not what a typical program achieves.